Viewing Test Case and Execution Details in Azure
You can view the test case and execution details in Azure under the QMetry Test Coverage section. This section provides a consolidated view of the work item, including test coverage, execution status, linked defects, and other related information.
Note
QMetry Test Coverage tab is visible only if the Azure project admin has enabled the project-level settings for the QMetry Test Management extension.
Refer to the help guide on Enabling Project-Level Setting in Azure DevOps to know more.
Prerequisites
QMetry Test Coverage Panel in Azure
The QMetry Test Coverage panel in Azure allows you to view the current status of associated test cases, their execution details, and any linked defects.
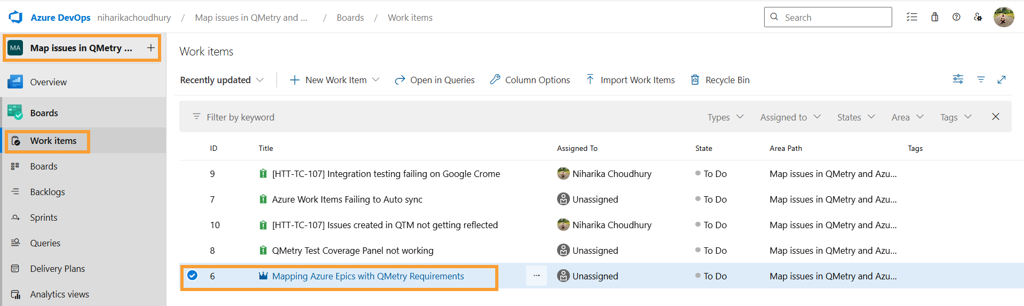
To open the QMetry Test Coverage Panel in Azure perform the following steps:
Select the project in Azure DevOps.
Click Work Items.
Select the desired Work Item.
Navigate to the Test Coverage tab to view test case and execution details.
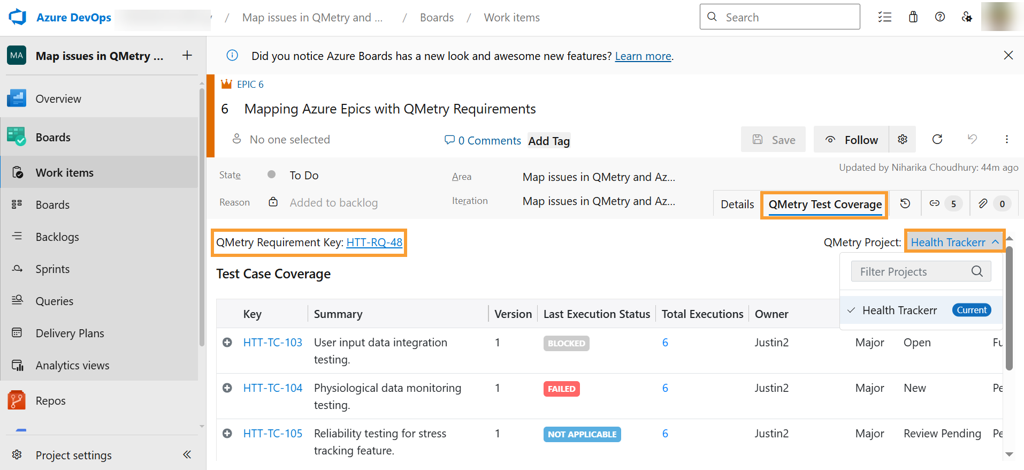
QMetry Test Coverage tab displays the following parameters:
QMetry Project: Displays the QMetry projects linked to the Azure story. For stories synced with more than one QMetry project, all associated projects appear in the drop-down list.
Note
When you open a synced work item from within a QMetry project, the QMetry Project list in the QMetry section of the Azure work item view automatically selects the originating QMetry project.
QMetry Requirement Key: Displays the Requirement Key linked to the Azure story.
Note
Clicking the Requirement Entity Key opens the requirement in QMetry, provided you are logged into QMetry and have access to the project.
Viewing Test Case Details in Azure
When you link a test case to a requirement mapped with an Azure Epic or User Story, the link syncs to Azure DevOps in real time. The test case appears under the QMetry Test Coverage tab of the related Work Item in Azure.
Steps
To view the test case details in Azure, perform the following steps:
Open the Azure Work Item (like an Epic or User Story) synced with a QMetry Requirement.
Select the QMetry Project.
Expand a test case row to view detailed Test Case Steps.
Outcome
The Test Case Coverage section displays all test cases linked to the Requirement.
The Last Execution Status reflects the most recent execution status, regardless of the linked version.
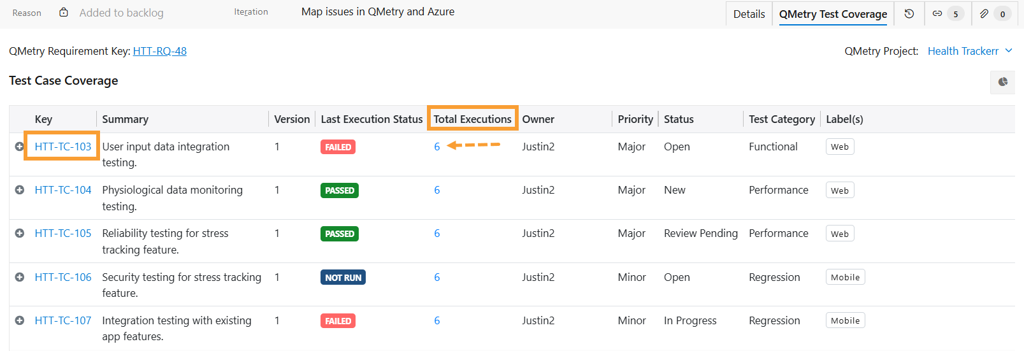
The Total Executions column displays the number of times a test case has been executed. Click the count to open the execution details. The execution details include the Test Run UDFs of each execution.
Note
The system displays test case and step details from the version linked to the requirement, while the execution status reflects the latest run regardless of the version.
Viewing Test Execution Details in Azure DevOps
The test execution summary appears under Test Coverage panel in Azure. The execution summary includes the details of the linked test cases and their executions. Only test cases linked to both the story and a test suite execution are displayed.
Use filters to view specific executions.
Filtering Test Case Executions
Click the Filter icon in the Test Case Execution Summary section to open the Execution Filters panel.
Filter test executions by project, release, cycle, platform, build, status, or test suite.
Applying filters displays only the relevant execution records on the screen.
Note
Applied filters resets upon page refresh.
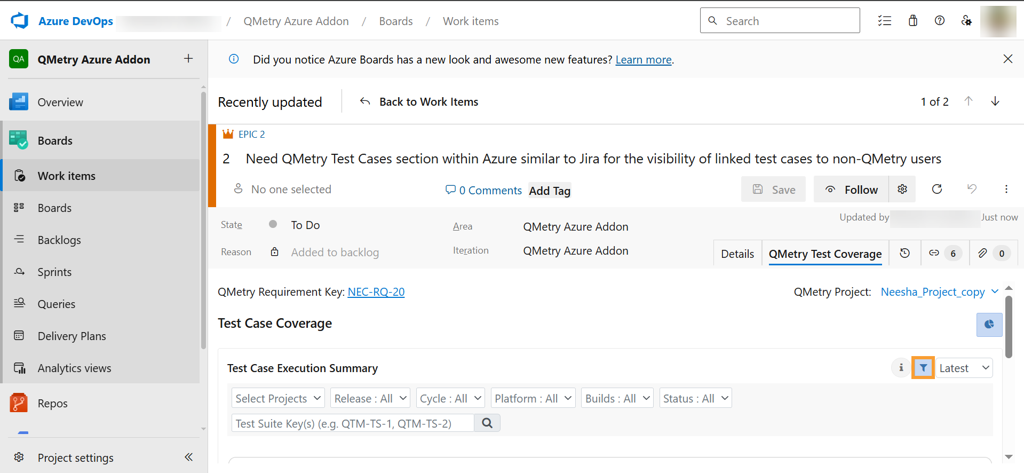
Viewing Test Case Execution Summary
The Test Case Execution Summary section under the QMetry Test Coverage tab gives an overview of test case executions linked to the Azure work item. It helps users track test progress, status, and execution details directly within Azure DevOps.
Note
The Test Execution covers all the test cases that are linked to the Test Suites.
“Not Run” test cases are also counted.
The system skips Archived Test Cases or Archived executions.
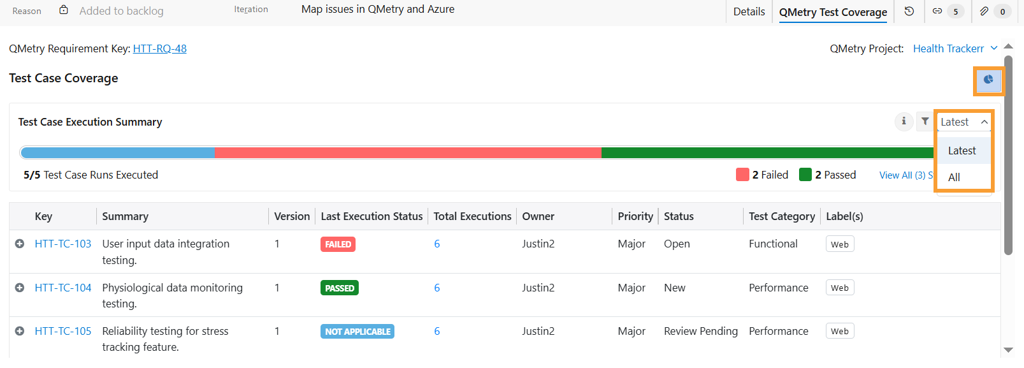
To view test case execution summary, perform the following steps:
Click the pie icon.
Apply filters. You can select from project, release, cycle, platform, build, status, or test suite.
Select Latest to view the latest executions or select All to list all executions.
Note
Click on the + near the key to expand the execution steps.
Click on the + near the key to expand the execution steps.
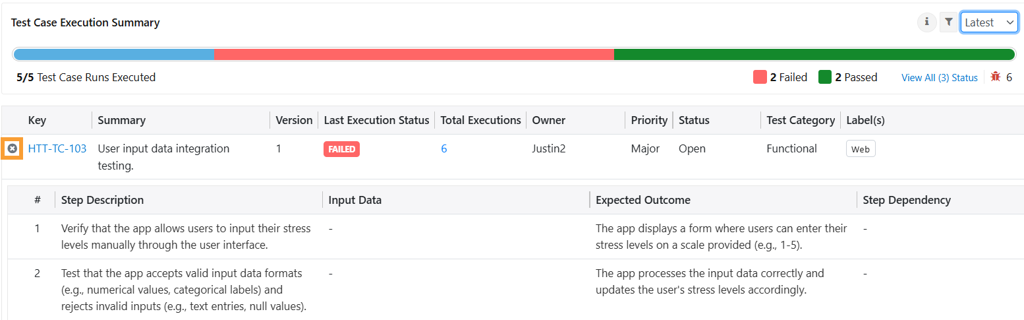
You can view and track key details such as execution status, number of executions, test case summary, priority, and individual step details.
Clicking on the Test Case Key, navigates you to the Test Case Details.
Viewing Test Suite Execution Details in Azure
You can open the execution details in two ways:
Click the Test Case Key.
Click the Total Executions count.
The Executions tab opens with the Test Case Key and summary in the page header. Click Back to return to the Test Coverage list. The Executions and Test Case Details tabs are on the right.
Filtering executions
Use the Execution Filters panel to narrow the list. You can filter by Project, Release, Cycle, Platform, Builds, and Status, or search by Test Suite Key(s).
Executions grid
The grid lists one row per execution of the test case, across all versions.
Click the test suite key to open the test suite in QMetry. Click the expand icon to see the row’s tabs.
The Executions tab displays the following details for all versions of that test case.
Test case step execution details.
Linked Bugs, Test logs, Comments for the test executions, and test step.
Test Run UDFs for each execution.
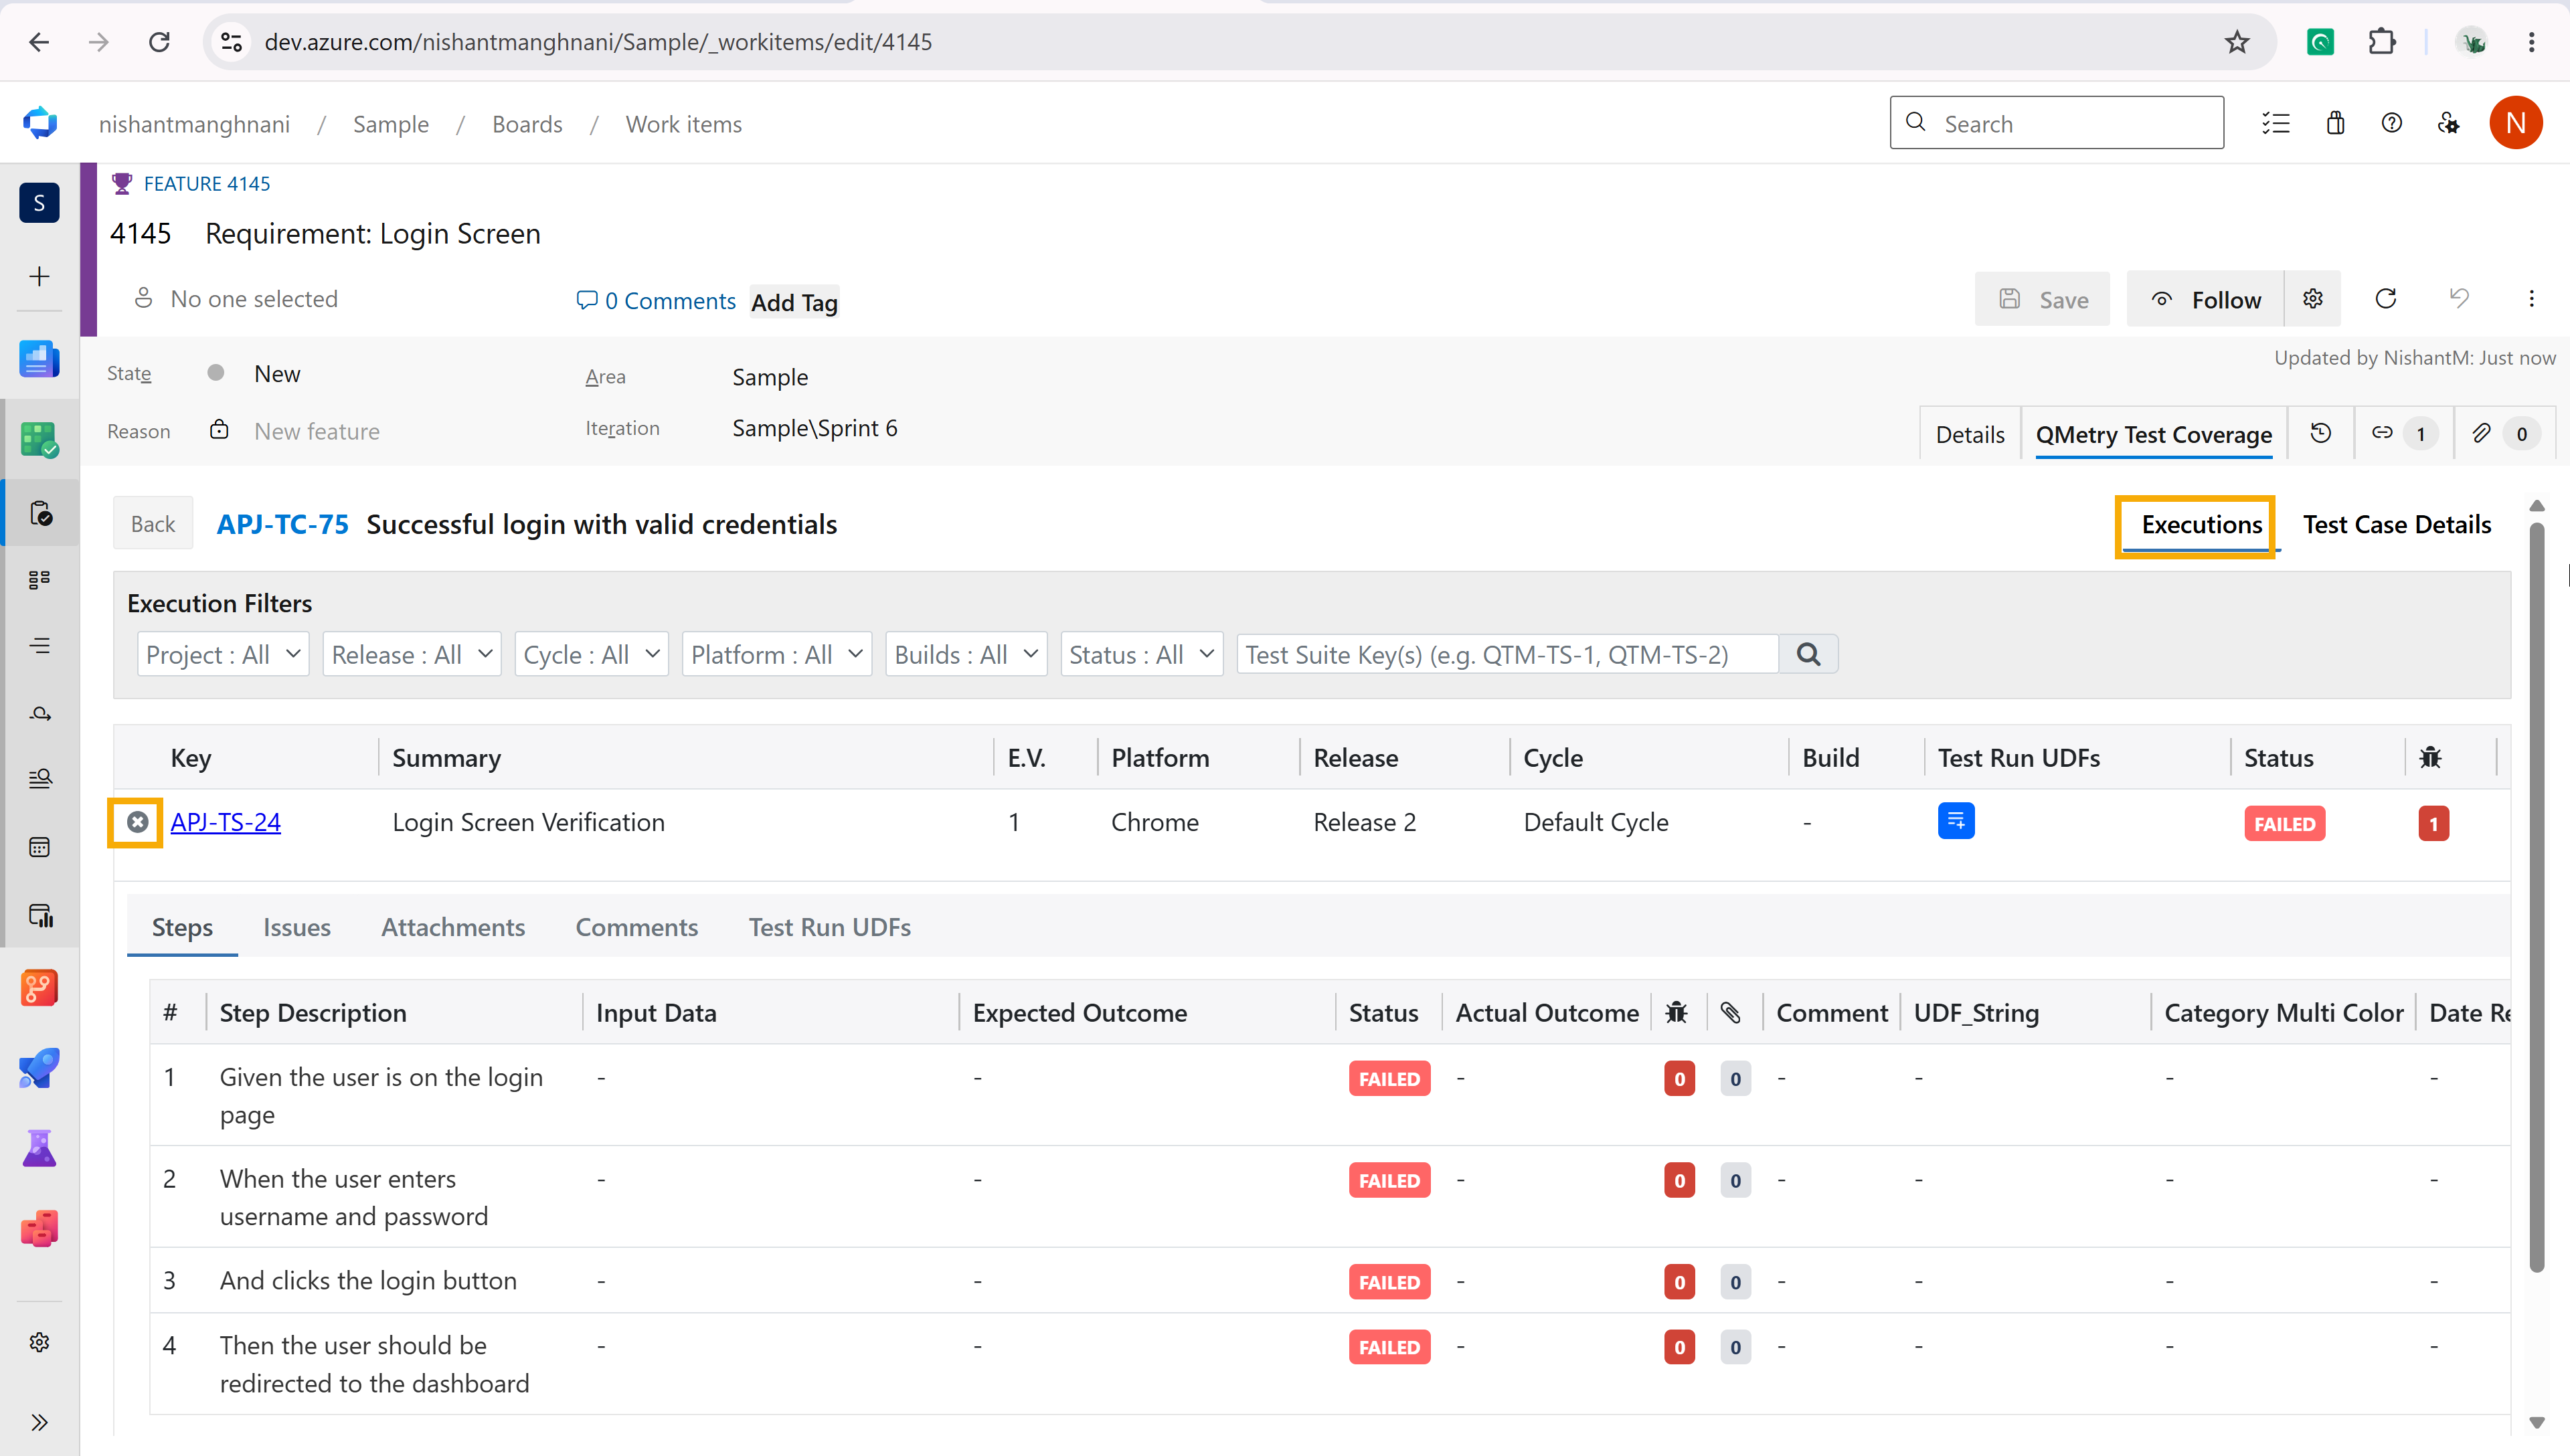
On this screen, you can review the execution history and related assets within the Azure work item:
View test suite details like Key, Summary, Execution Version, Release, Cycle, Build, and Status.
Filter executions using various parameters (e.g., Release, Cycle, Platform, Status).
Expand a test suite row to view additional tabs: Steps, Issues, Attachments, Comments and Test Run UDFs for a detailed breakdown of each execution.
Note
Clicking the key under the Executions tab opens the Test Suite page in QMetry.
If the issue is linked directly to the test case without an execution, the Executions tab shows no execution details.
Viewing Test Run UDFs in Azure
Test Run UDFs are user-defined fields that testers fill in when they execute a test case in QMetry. In Azure, you can see the values for each execution without leaving the work item.
Visibility conditions
The Test Run UDFs column and tab appear only if Test Run UDFs are associated with the Test Run module of the selected QMetry project.
Test Run UDFs Icon
The icon in the Test Run UDFs column shows at a glance whether the execution data is complete.
Icons | Meaning |
|---|---|
Green icon with a star | All mandatory Test Run UDFs have values. |
Blue icon with a star | At least one mandatory Test Run UDF is blank. |
Blue icon without a star | The execution has no mandatory Test Run UDFs. |
To view Test Run UDFs, do the following:
Open the Azure work item and go to the QMetry Test Coverage tab.
Click the Test Case Key or the Total Executions count.
On the Executions tab, expand the execution row.
Open the Test Run UDFs tab, the last tab in the row. You can also click the icon in the Test Run UDFs column.
Viewing Test Case Details in Azure
The Test Case Details tab displays details of system fields as well as user-defined fields entered for the test case in QMetry and its Execution Status Summary.
You can navigate to the Test Case Details tab in two ways:
Test Case Key.
Total Executions.
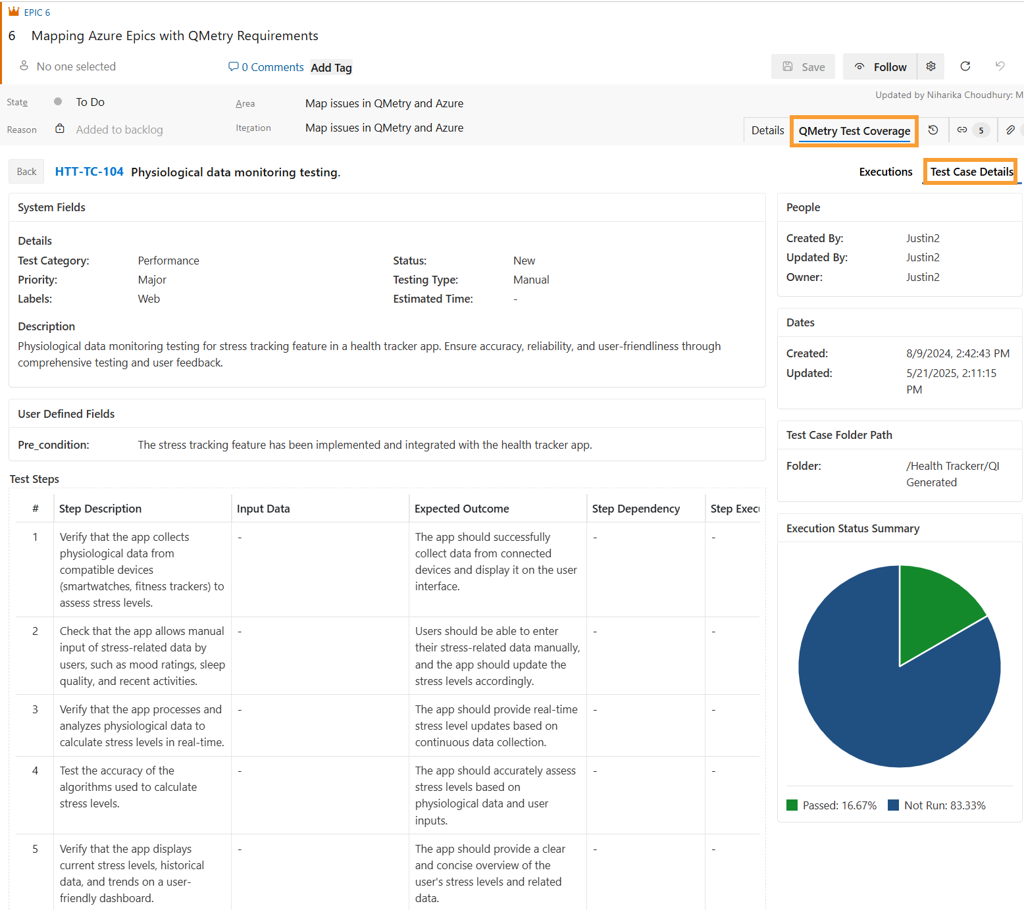
Executions
The Executions tab displays test suites with executed test cases. Expanding the test suite displays the: Steps, Issues, Attachments, Comments and Test Run UDFs. This helps quickly access detailed test execution data and related assets within Azure.
Note
If the issue links directly to the test case without execution, the Executions tab does not display any execution details and shows a relevant message instead.
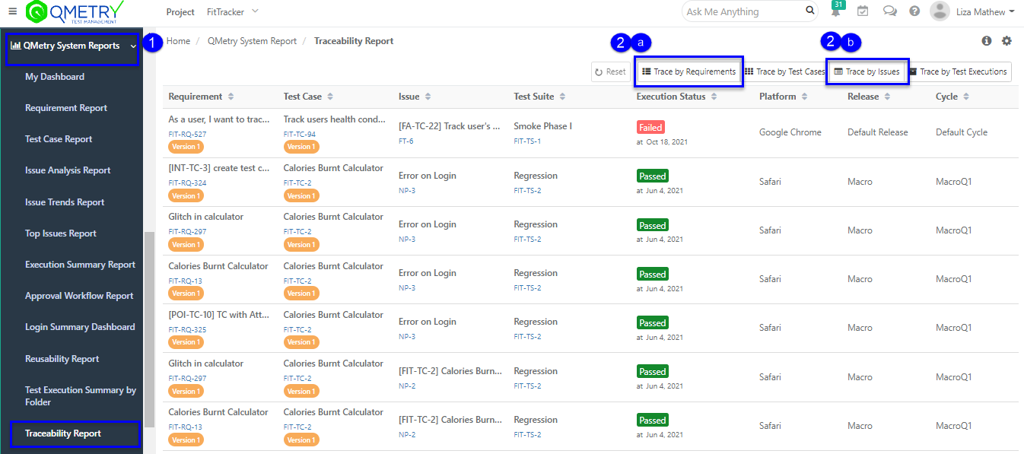
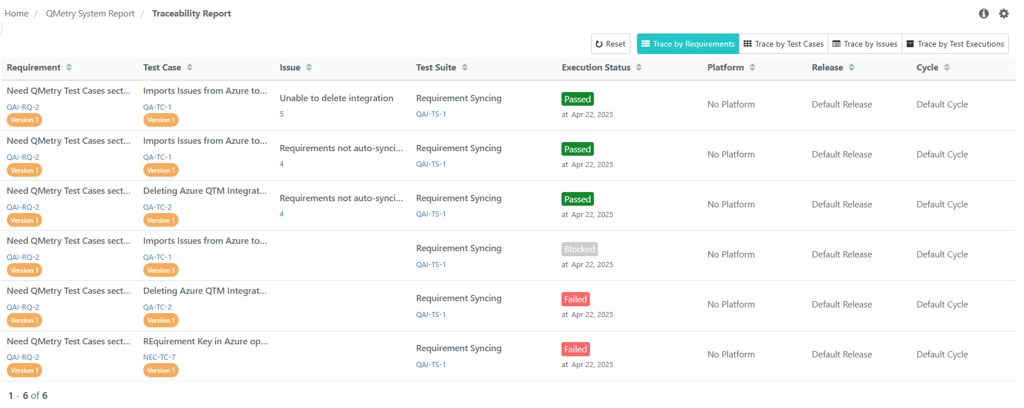
Viewing Traceability Reports in QMetry
To generate traceability reports, perform the following steps:
Go to Reports and select Traceability Report.
Select Trace by:
For Requirement Traceability: Select Trace by Requirement.
For Issue Traceability: Select Trace by Issue.
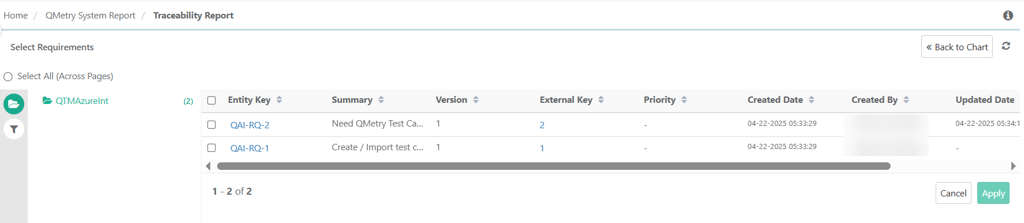
Select Entity and click Apply.